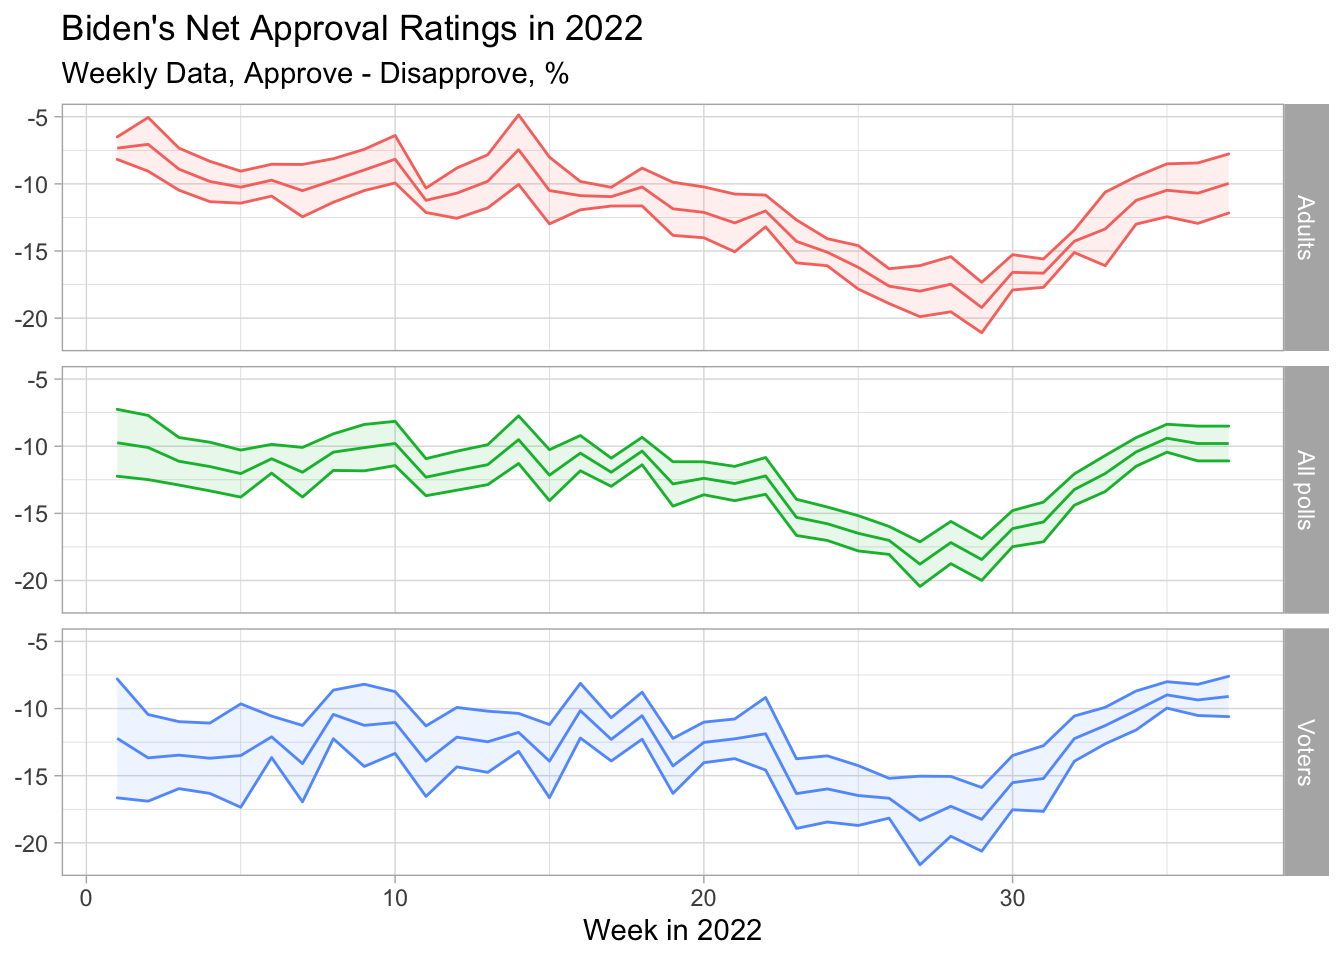
Biden's Approval Margins
# Import approval polls data directly off fivethirtyeight website
approval_polllist <- read_csv('https://projects.fivethirtyeight.com/biden-approval-data/approval_polllist.csv')
## Rows: 4559 Columns: 22
## ── Column specification ────────────────────────────────────────────────────────
## Delimiter: ","
## chr (12): president, subgroup, modeldate, startdate, enddate, pollster, grad...
## dbl (9): samplesize, weight, influence, approve, disapprove, adjusted_appro...
## lgl (1): tracking
##
## ℹ Use `spec()` to retrieve the full column specification for this data.
## ℹ Specify the column types or set `show_col_types = FALSE` to quiet this message.# Use `lubridate` to fix dates, as they are given as characters.
approval_polllist_date <- approval_polllist %>%
mutate(startdate = mdy(startdate), enddate = mdy(enddate))Plot of the net approval of Biden for each week in 2022, along with its 95% confidence interval. There are various dates given for each poll, we have used the enddate.
## `summarise()` has grouped output by 'week'. You can override using the
## `.groups` argument.