Youth Risk Behaviour Surveillance
Every two years, the Centers for Disease Control and Prevention conduct the Youth Risk Behavior Surveillance System (YRBSS) survey, where it takes data from high schoolers (9th through 12th grade), to analyze health patterns. We worked with a selected group of variables from a random sample of observations during one of the years the YRBSS was conducted.
data(yrbss)ggplot(yrbss,aes(x= weight)) + geom_histogram()## `stat_bin()` using `bins = 30`. Pick better value with `binwidth`.## Warning: Removed 1004 rows containing non-finite values (stat_bin).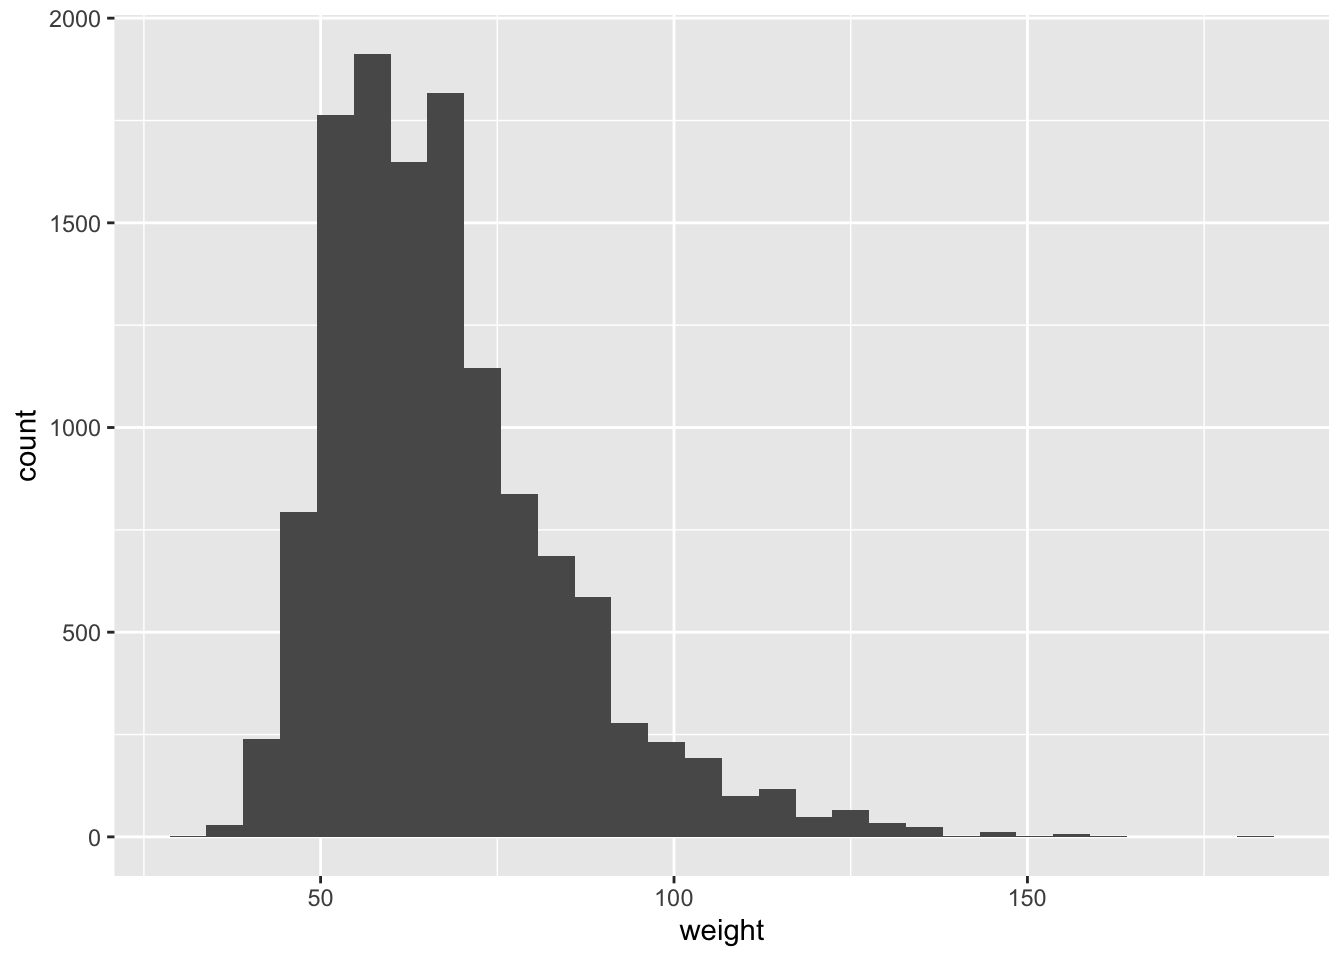
yrbss_3d <- yrbss %>% mutate(physical_3plus = ifelse(physically_active_7d>= 3/7, 'yes', 'no'))
yrbss_3d <- na.omit(yrbss_3d)
ggplot(yrbss_3d, aes(x = physical_3plus, y = weight)) +
geom_boxplot()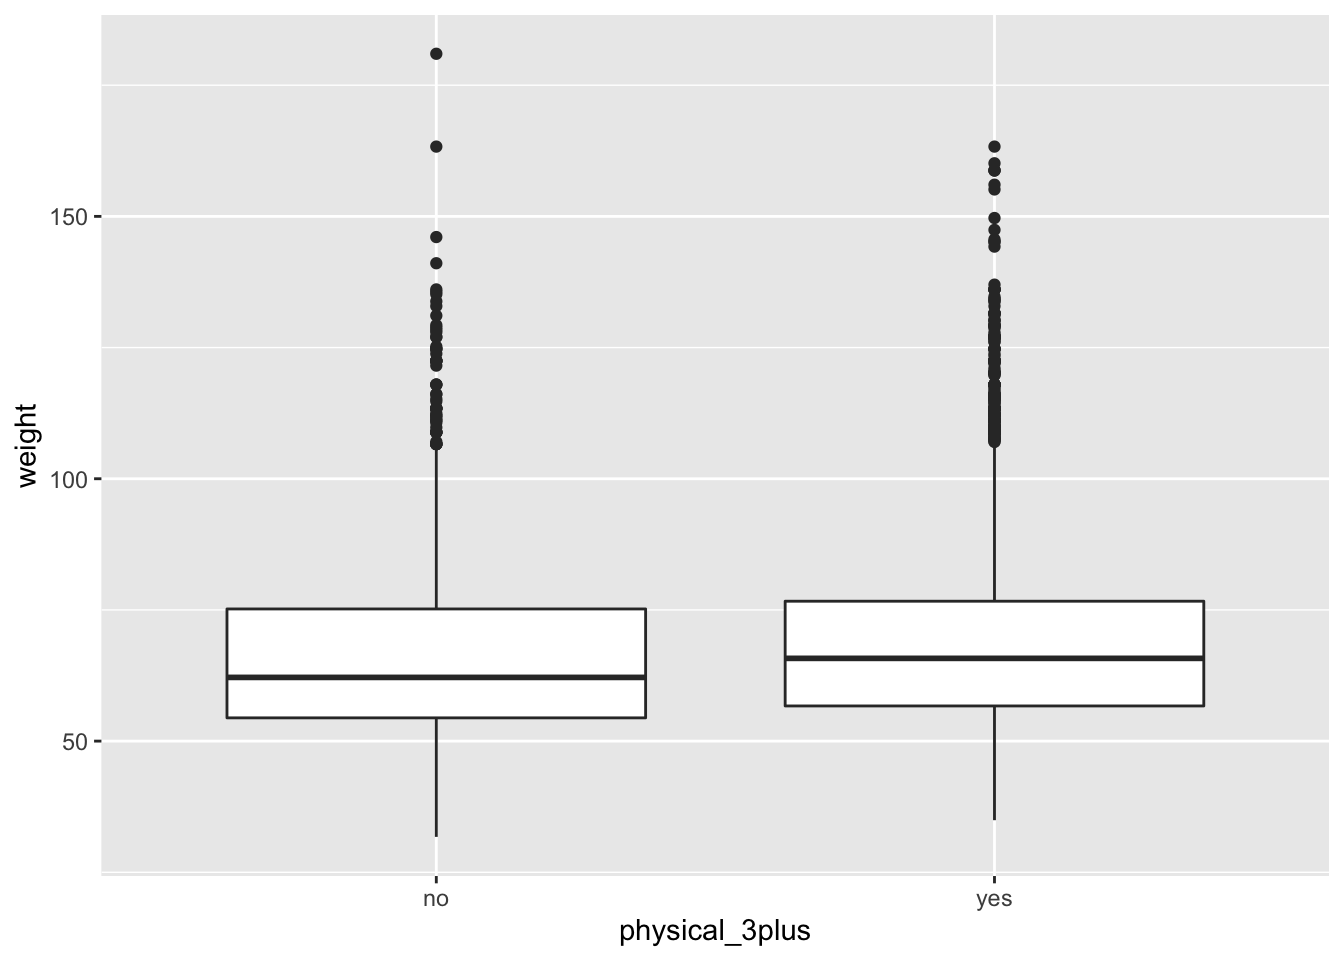 From the boxplot we see that The proportion of students who do physical exercise less than 3 days a week seem to have higher median weight as compared the ones who don’t.